📓 How the Web Works: Developer Tools
As web developers, we often need to look at the requests and responses that come and go from client and server and back. In this lesson, we are going to look at the Developer Tools in Chrome that offer a peek into the requests and responses in the browser.
Chrome Developer Tools
The Chrome browser is the preferred browser for many web developers because it offers tools that make developing easier. We've already used these developer tools a ton in Intro to Programming. Primarily to log content to the JavaScript console and debug broken websites. Let's explore how these tools can also allow us to observe the request-response conversation between our browser client and outside web servers.
Accessing Developer Tools
As you may recall, we access Chrome's developer tools by clicking the View option in the toolbar, then selecting Developer > Developer Tools.
Alternatively, keyboard shortcuts are Command + Option + J on Mac and Ctrl + Shift + I on PC. On Epicodus classroom machines the shortcut is [Windows] + Alt + J.
Viewing HTTP Requests and Responses
The Developer Tools pane will open on the side or bottom of our browser window. To see HTTP requests and responses for pages we visit, we can select the Network tab (the fourth tab from the left) on the top toolbar of the pane.
While located in the Network area of the Chrome developer tools, we'll navigate to this URL on Learn How to Program (your courses URL might look slightly different depending on your track):
https://full-time.learnhowtoprogram.com/
We'll see the following appear in the Network area:
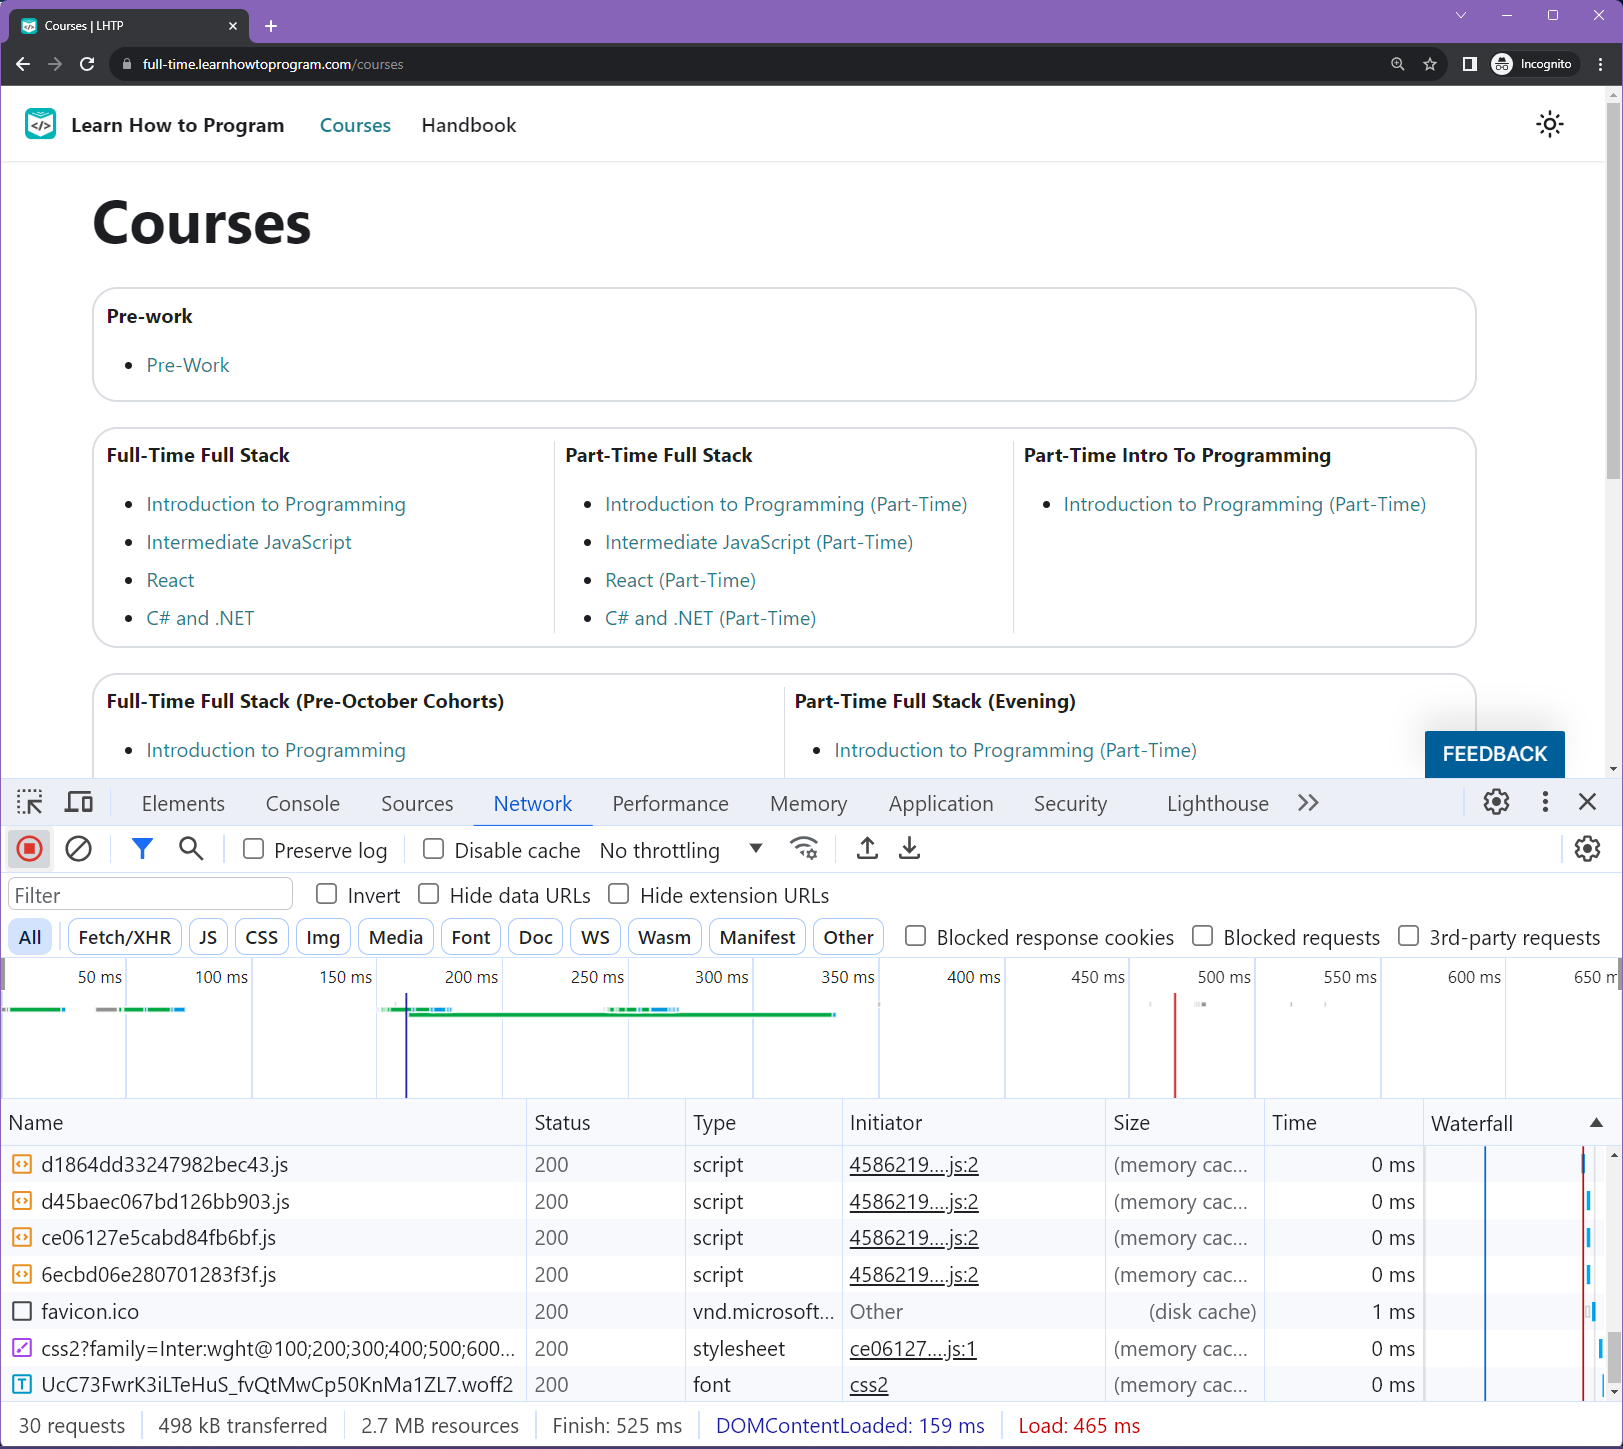
Each of these lines represents a request made from our client to the LearnHowToProgram server.
The first request in this list is for the
coursesresource. We see it was successful because there is a status of200.The
typeof resource isdocument(in this case an HTML document). As you may imagine, there are still more resources necessary to display this page beyond the HTML document. For each additional resource (stylesheet, script, image files, etc) required in the HTML, the client makes a new request and the server will return a new response. We can see otherTypes listed in this pane, likescript,font, andstylesheet.
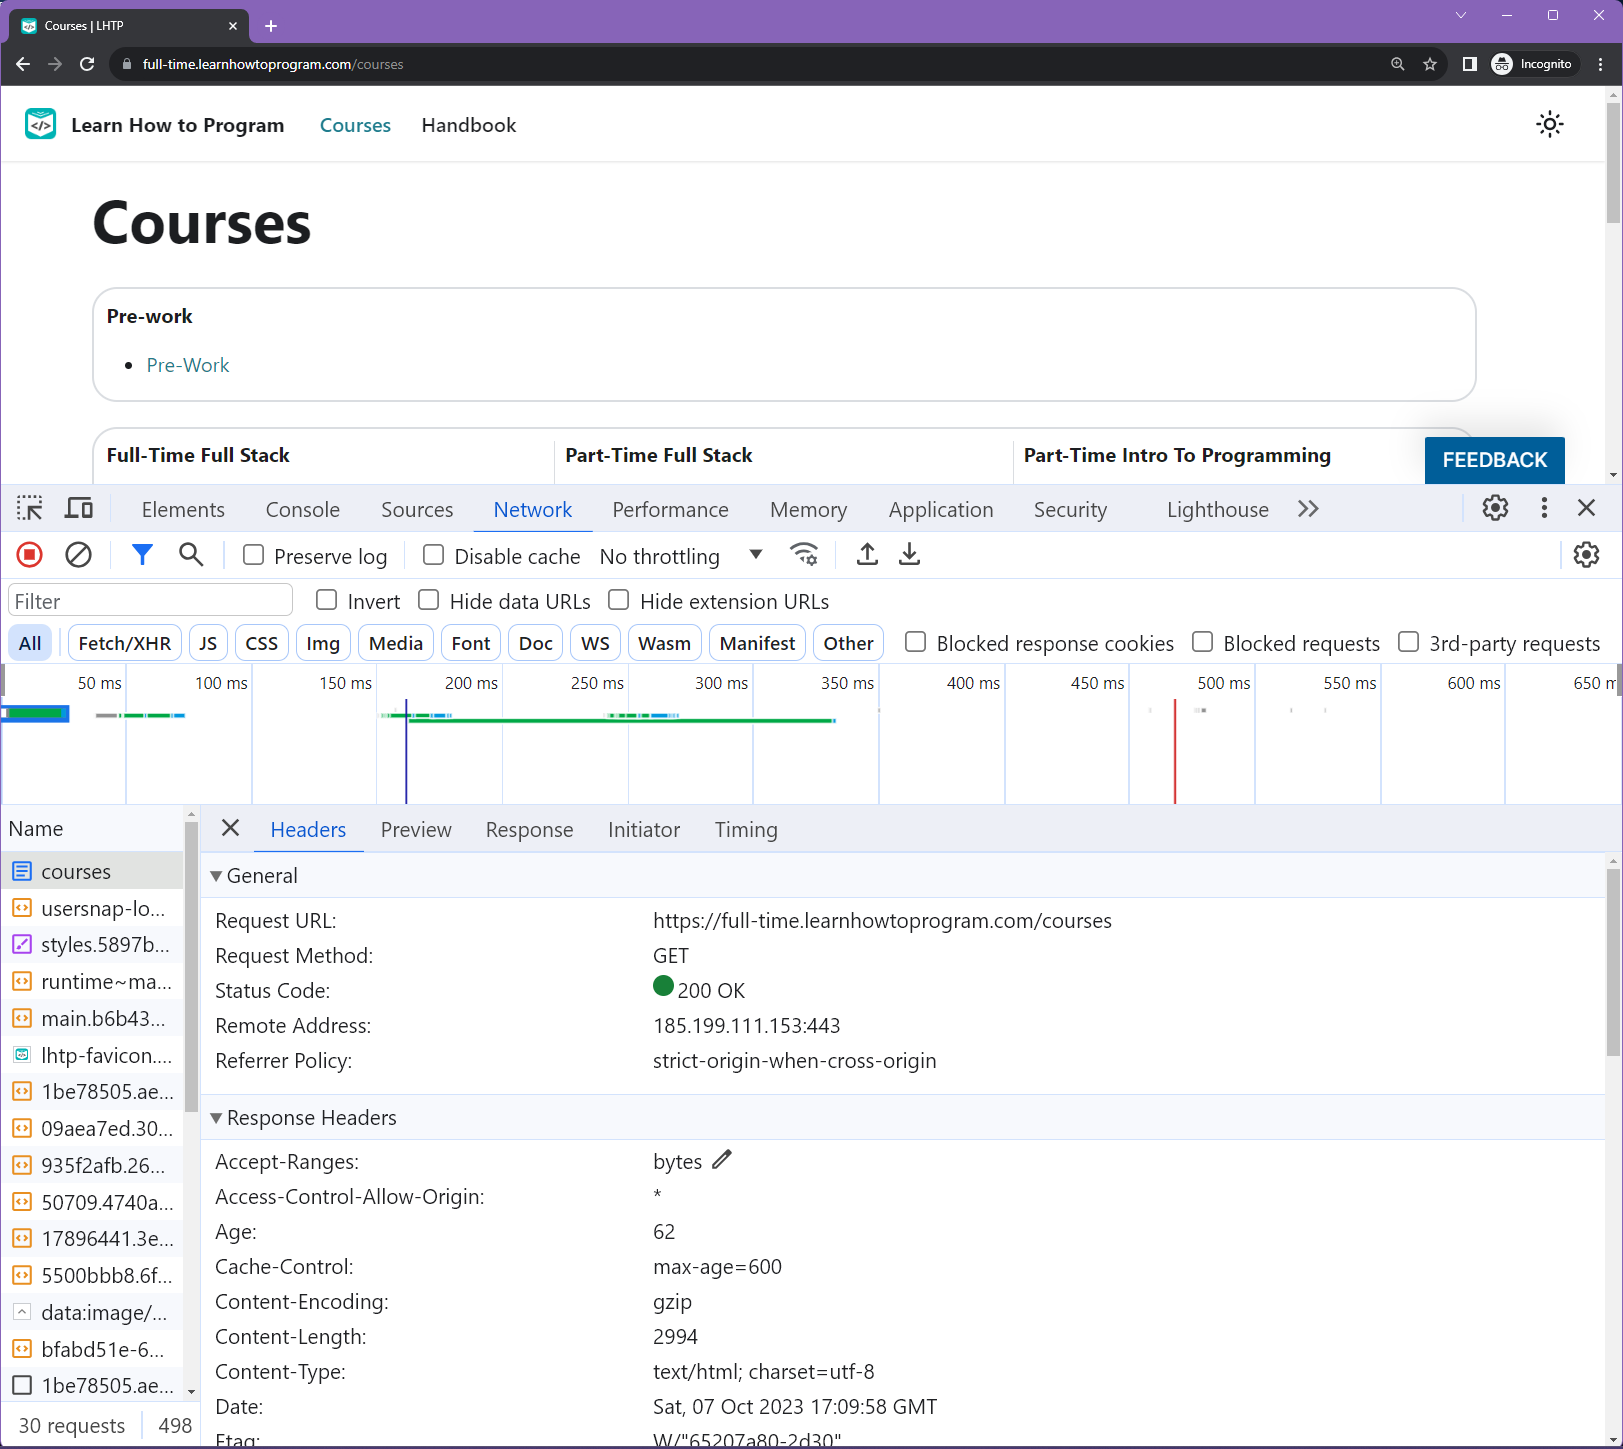
Request Details
When we click on a request we can see more details about it. In the General section we see the IP address for the server and the URL sent in the request, among other things:
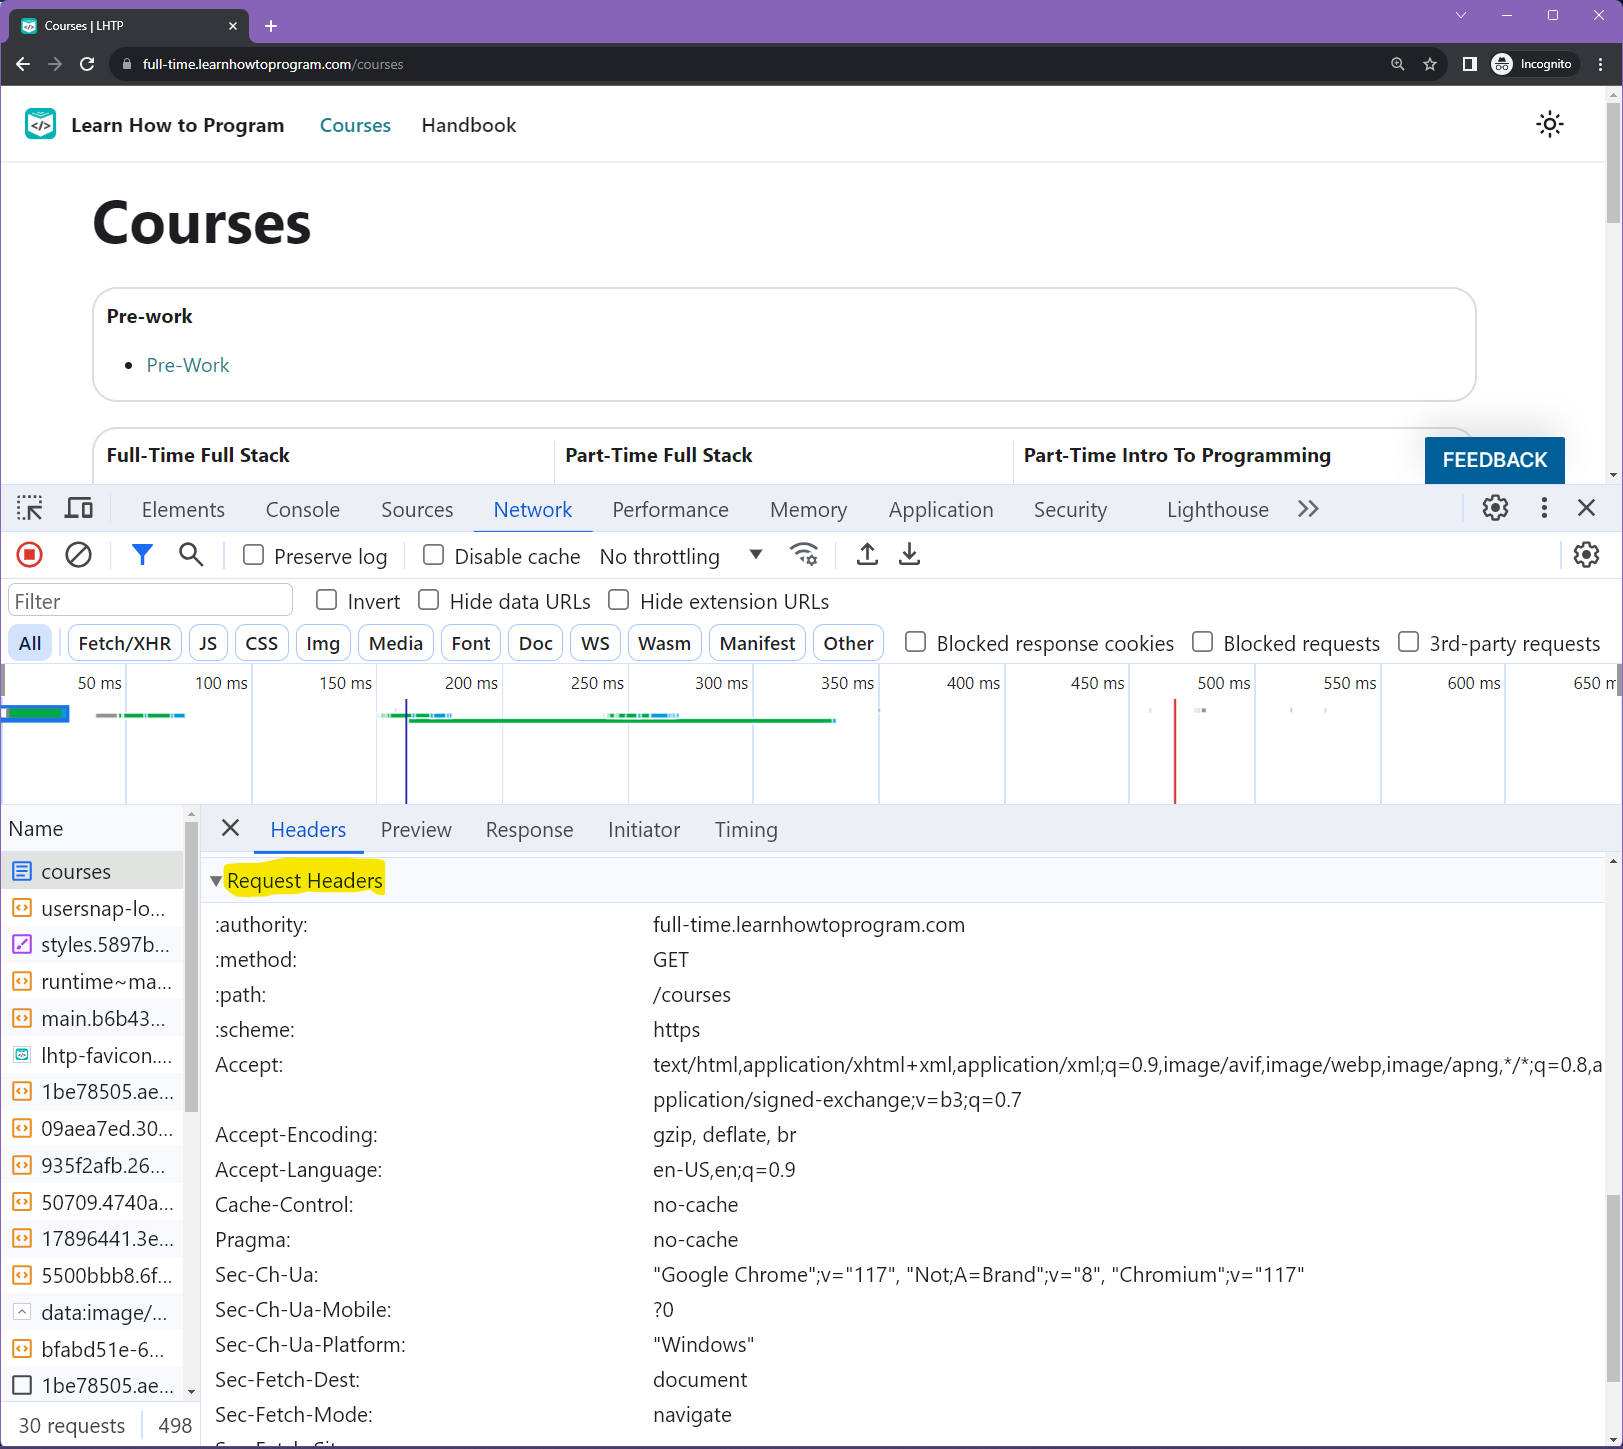
Under Request Headers we can see the headers, including several previously noted in the URL lesson: the host name (a subcomponent of authority), path, scheme, etc:
Response Details
We can also see response details for the courses request in the Response Headers section:
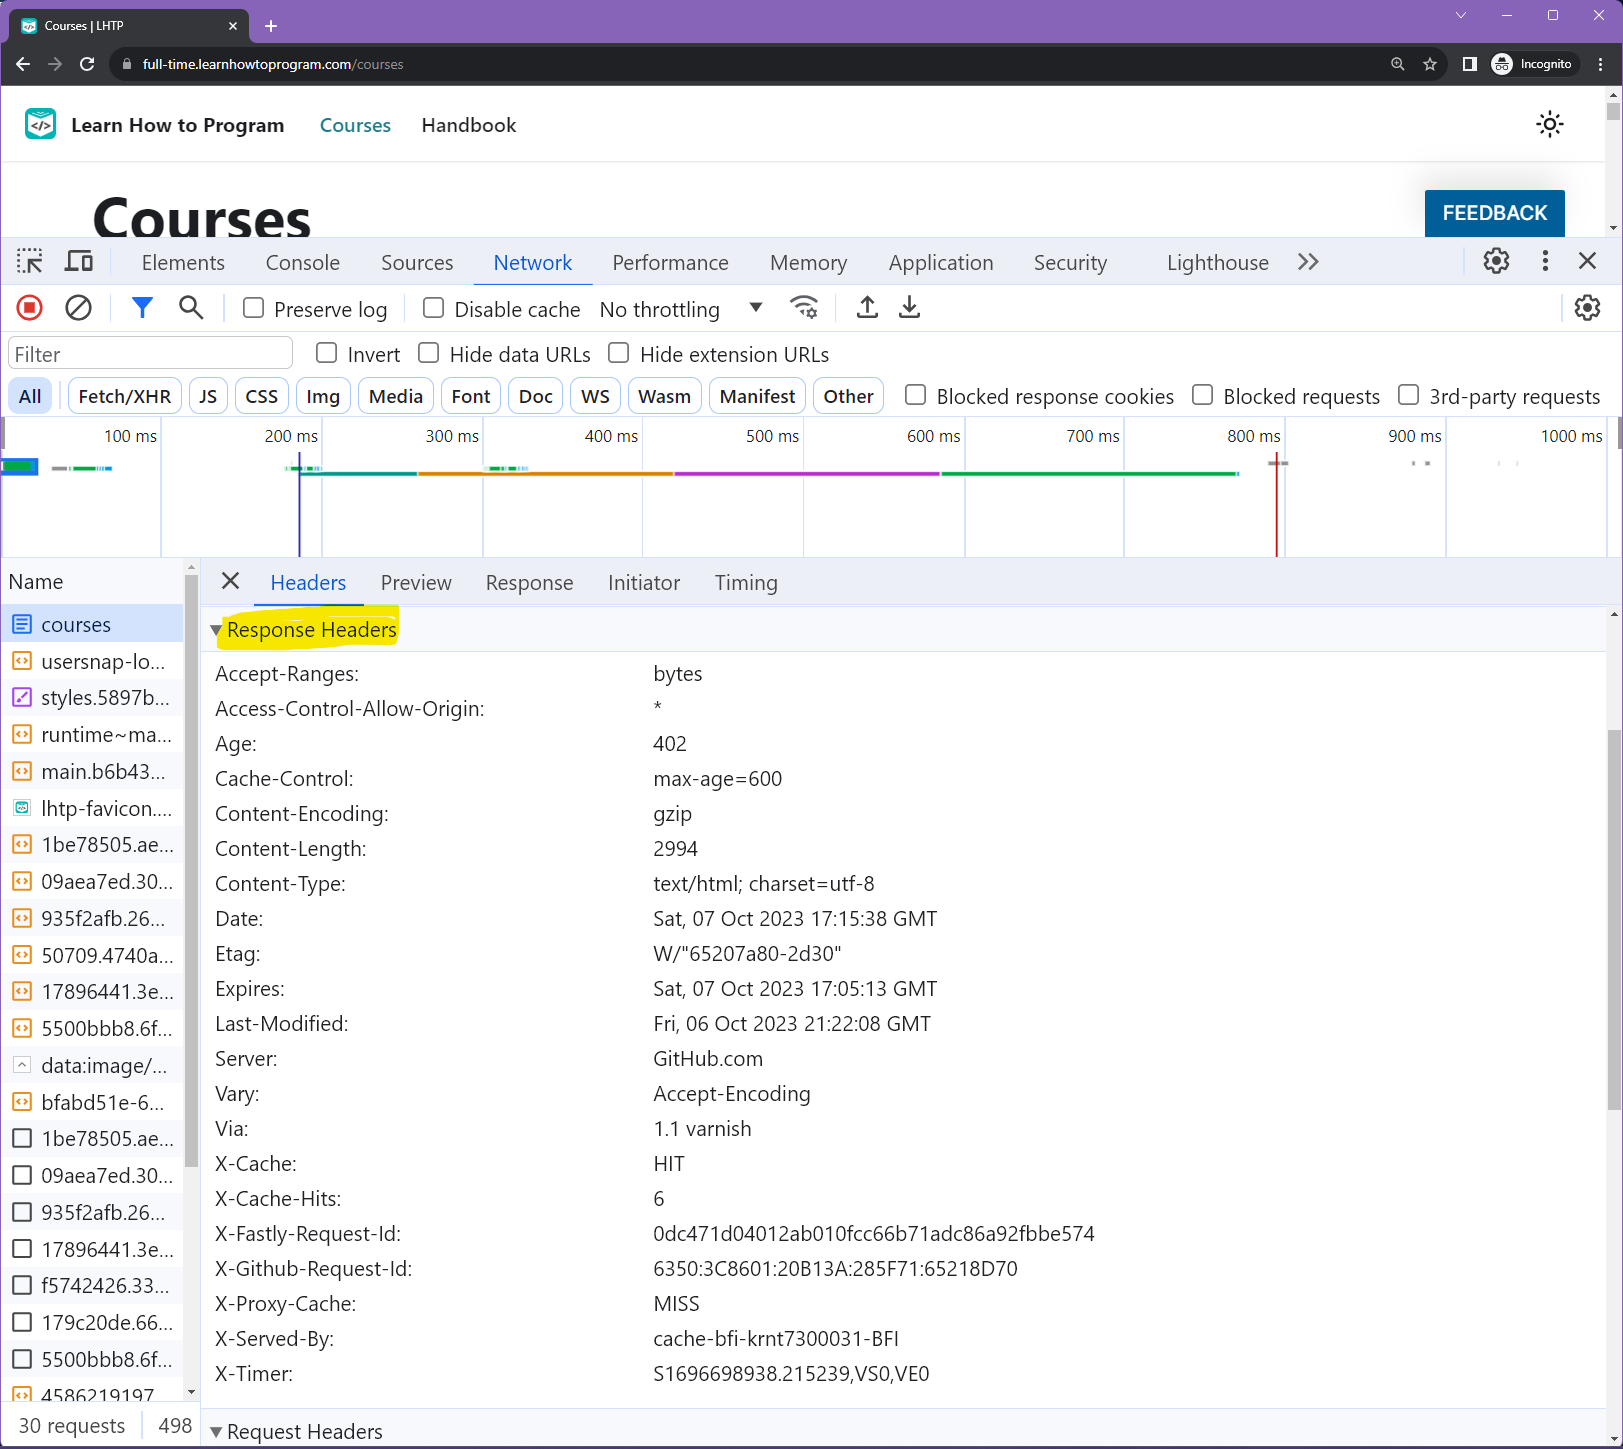
We see that the server completed the successful processing of the request, showing us content type, date, etc. returned in the response message.
To see the raw response that also includes the response body, click the Response tab to the right of Headers:
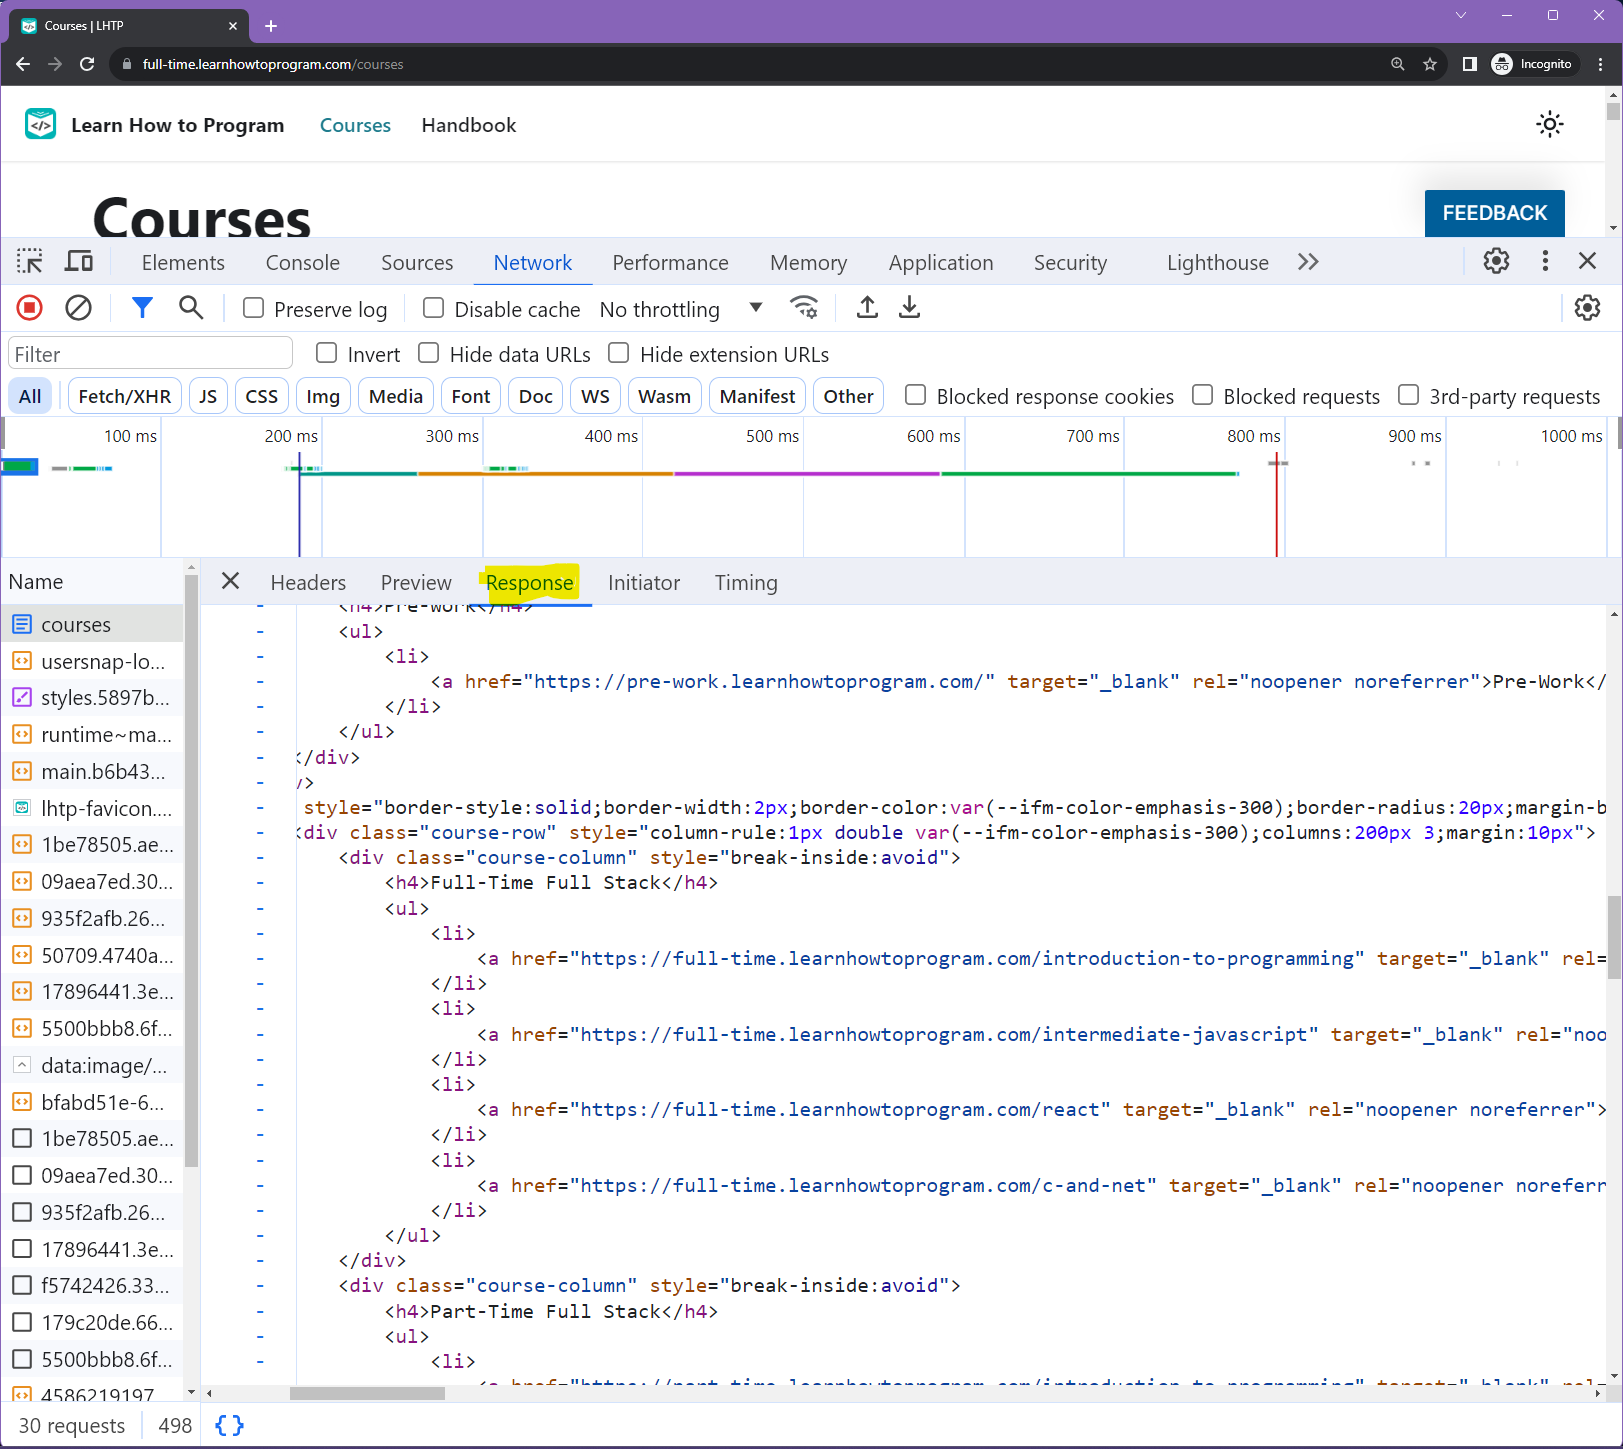
And check it out! There's all the HTML for the page!
Notice also the lower left of the window states that a total of 30 requests were made to load this / area of the site. So when we arrive on the Courses page for Learn How To Program the HTTP request-response cycle includes 30 unique requests with 30 unique responses.
Visit several sites with the Developer Tools and see if you can analyze the request-response details behind the final display that you see in your browser window.